bâches, Barrières constructions, Affichage institutionnel
Dans la rue aussi, on peut observer certaines dispositions prises par les pouvoirs publics pour raccrocher les citoyens au projet du piétonnier: la Ville tente de limiter les dégâts, de pallier aux nuisances du réaménagement.
L’omniprésence des barrières de construction, par exemple, suscitait beaucoup de critiques sur les réseaux sociaux. Durant l’été 2018 ces barrières commencent à être recouvertes de bâches, sur lesquelles est imprimé le rendu du projet d’aménagement. Ces bâches montrent l’après travaux, et communiquent le point de contact unique (Julien Mille). Ponctuellement, ces immenses surfaces d’affichage sont exploitées pour exposer des données plus spécifiques : pour expliquer les enjeux techniques d’un chantier, pour montrer les dernières pièces archéologiques qui y ont été mises à jour , ou pour y faire une campagne de sensibilisation aux droits des femmes .
Par ailleurs, ces grandes surfaces constituent aussi un emplacement rêvé pour accueillir d’autres voix à la recherche de manières de se faire entendre sur ce que nous proposons de comprendre comme un espace public physique et matériel auquel les passant.e.s contribuent par les objets et traces qu’ils/elles y laissent: des tags et messages critiques y prennent place assez rapidement, parfois en détournant les messages d’origine, parfois en y répondant.
Data in place
Depuis le début de la recherche, nous nous intéressons à la représentation des données dans l'espace public. Pour nous, les croix de pharmacie sont un bon exemple, et qui plus-est, mis à jour en temps réel. En effet, celles-ci affichent l'heure et la température du lieu où elles se trouvent et lorsqu'elles sont allumées, on sait que la pharmacie est ouverte.
Google_Map
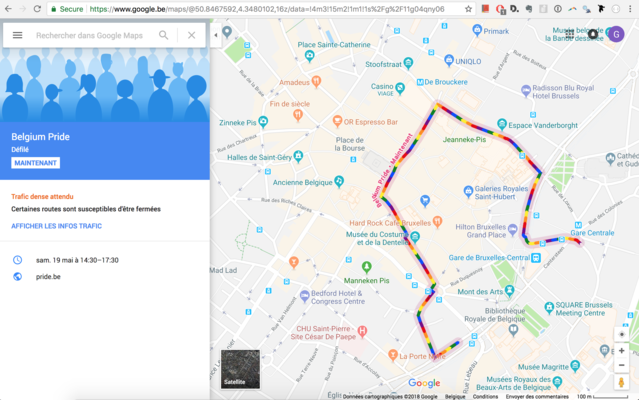
One key change in how people experience and visualise the city in the last 20 years has been the availability of GPS tracker through the ownership of smartphones. This technology gave users a 2D, bird view representation of the city at their fingertips. Google map is one of the most popular GPS tracking software and is used by many people. But as no representation is entirely objective, the choices made through the algorithm of the firms have an impact on the way the city is represented. It is possible to say that google map is computational subjective cartography. We can find this subjectivity in the choice to highlight certain cities, restaurants or area of interest. But also deciding what is a green space and what is not.<br /> [In a very insightful post](https://www.justinobeirne.com/google-maps-moat) Justin O’Beirne explains how google map built the area of interest through algorithmic computation and that, in one exemple, those cover most of subjective cartography participants pointed as zone of interest.<br /> What is interesting is that this cartography is evolving in almost real time and can be adapted to event, such as the gay pride.
La Coupe du Monde
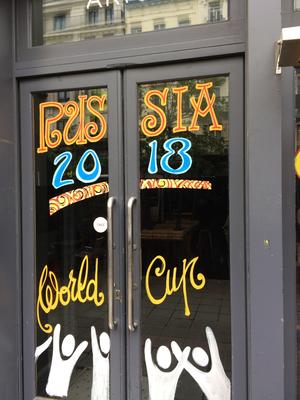
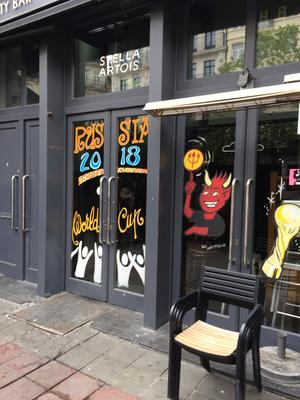
All around the piétonnier, one can see different visible signs of the world cup that takes place this summer. It ranges from painting on bar windows to flags on balcony or advertising featuring players. It is interesting to see how such events change public space by their objectal representation.<br /> The importance of this event is such that the city prohibited any outdoor screening of the matches. We suppose that it is by fear of public unrest after the incident of the so called “riots” last November or by fear that massive gathering would be the target of terrorist attacks.


